FIG. 02.2 — Project notes
- Independent
- Finished
ORALBIOME: Reproducible 16S rRNA Analysis of the Oral Microbiome in Periodontitis
A reproducible Python pipeline that asks whether the salivary bacterial community differs between periodontally healthy people and people with periodontitis, with pre-registered predictions, negative and positive controls, and a replication cohort.
Associations only — no clinical claims
Associations in a small, cross-sectional dataset, not causal or clinical findings. Nothing here should be used to diagnose, predict or treat periodontitis.
- PERMANOVA R², healthy vs periodontitis
- 0.082 (p = 0.015)
- Classifier AUC, without its top taxon
- 0.92 → 0.64
- Classifier AUC, replication cohort
- 0.52 [0.32, 0.72]
01Problem
Does the salivary bacterial community differ between periodontally healthy people and people with periodontitis? The pipeline runs on a real public 16S rRNA dataset, tests predictions written in HYPOTHESIS.md before any analysis, includes negative and positive controls, and checks whether the findings replicate in a second group of participants.
02Question
Can community composition alone predict periodontitis status — and does the signal replicate?
03Data
Unstimulated saliva, 16S rRNA V3–V4, Illumina NovaSeq; periodontitis diagnosed with the 2018 AAP/EFP classification. Source study: Guo Z., Yu X., Liu Y., Hu Q., Zhang Z., Zhang C., Li J. (2026), “A comparative analysis of oral microbial communities in hypertensive patients with and without chronic periodontitis,” BMC Oral Health 26(1):836, doi:10.1186/s12903-026-08144-6. Processed feature table: Guo, Ziyin (2025), figshare, doi:10.6084/m9.figshare.29897750.v1 (CC BY 4.0). 25,540 features, 67 samples and 4,503,386 reads; primary comparison 16 healthy vs 18 periodontitis, replication 17 hypertension vs 16 hypertension + periodontitis.
04Methods
- Data layer: downloads and caches the figshare deposit, parses the BIOM table, writes a QC report, and flags samples where more than 50% of reads come from features seen in no other sample.
- Preprocessing: aggregation to genus, a prevalence filter (≥ 10% of samples and mean relative abundance ≥ 0.01%), rarefaction to 44,786 reads for alpha diversity, and CLR with pseudocount 0.5 for everything else.
- Alpha diversity: Shannon, Gini-Simpson, observed richness, Pielou's evenness, Chao1 and ACE; Mann-Whitney U with rank-biserial r and bootstrap CIs, BH correction across metrics, and two sensitivity analyses.
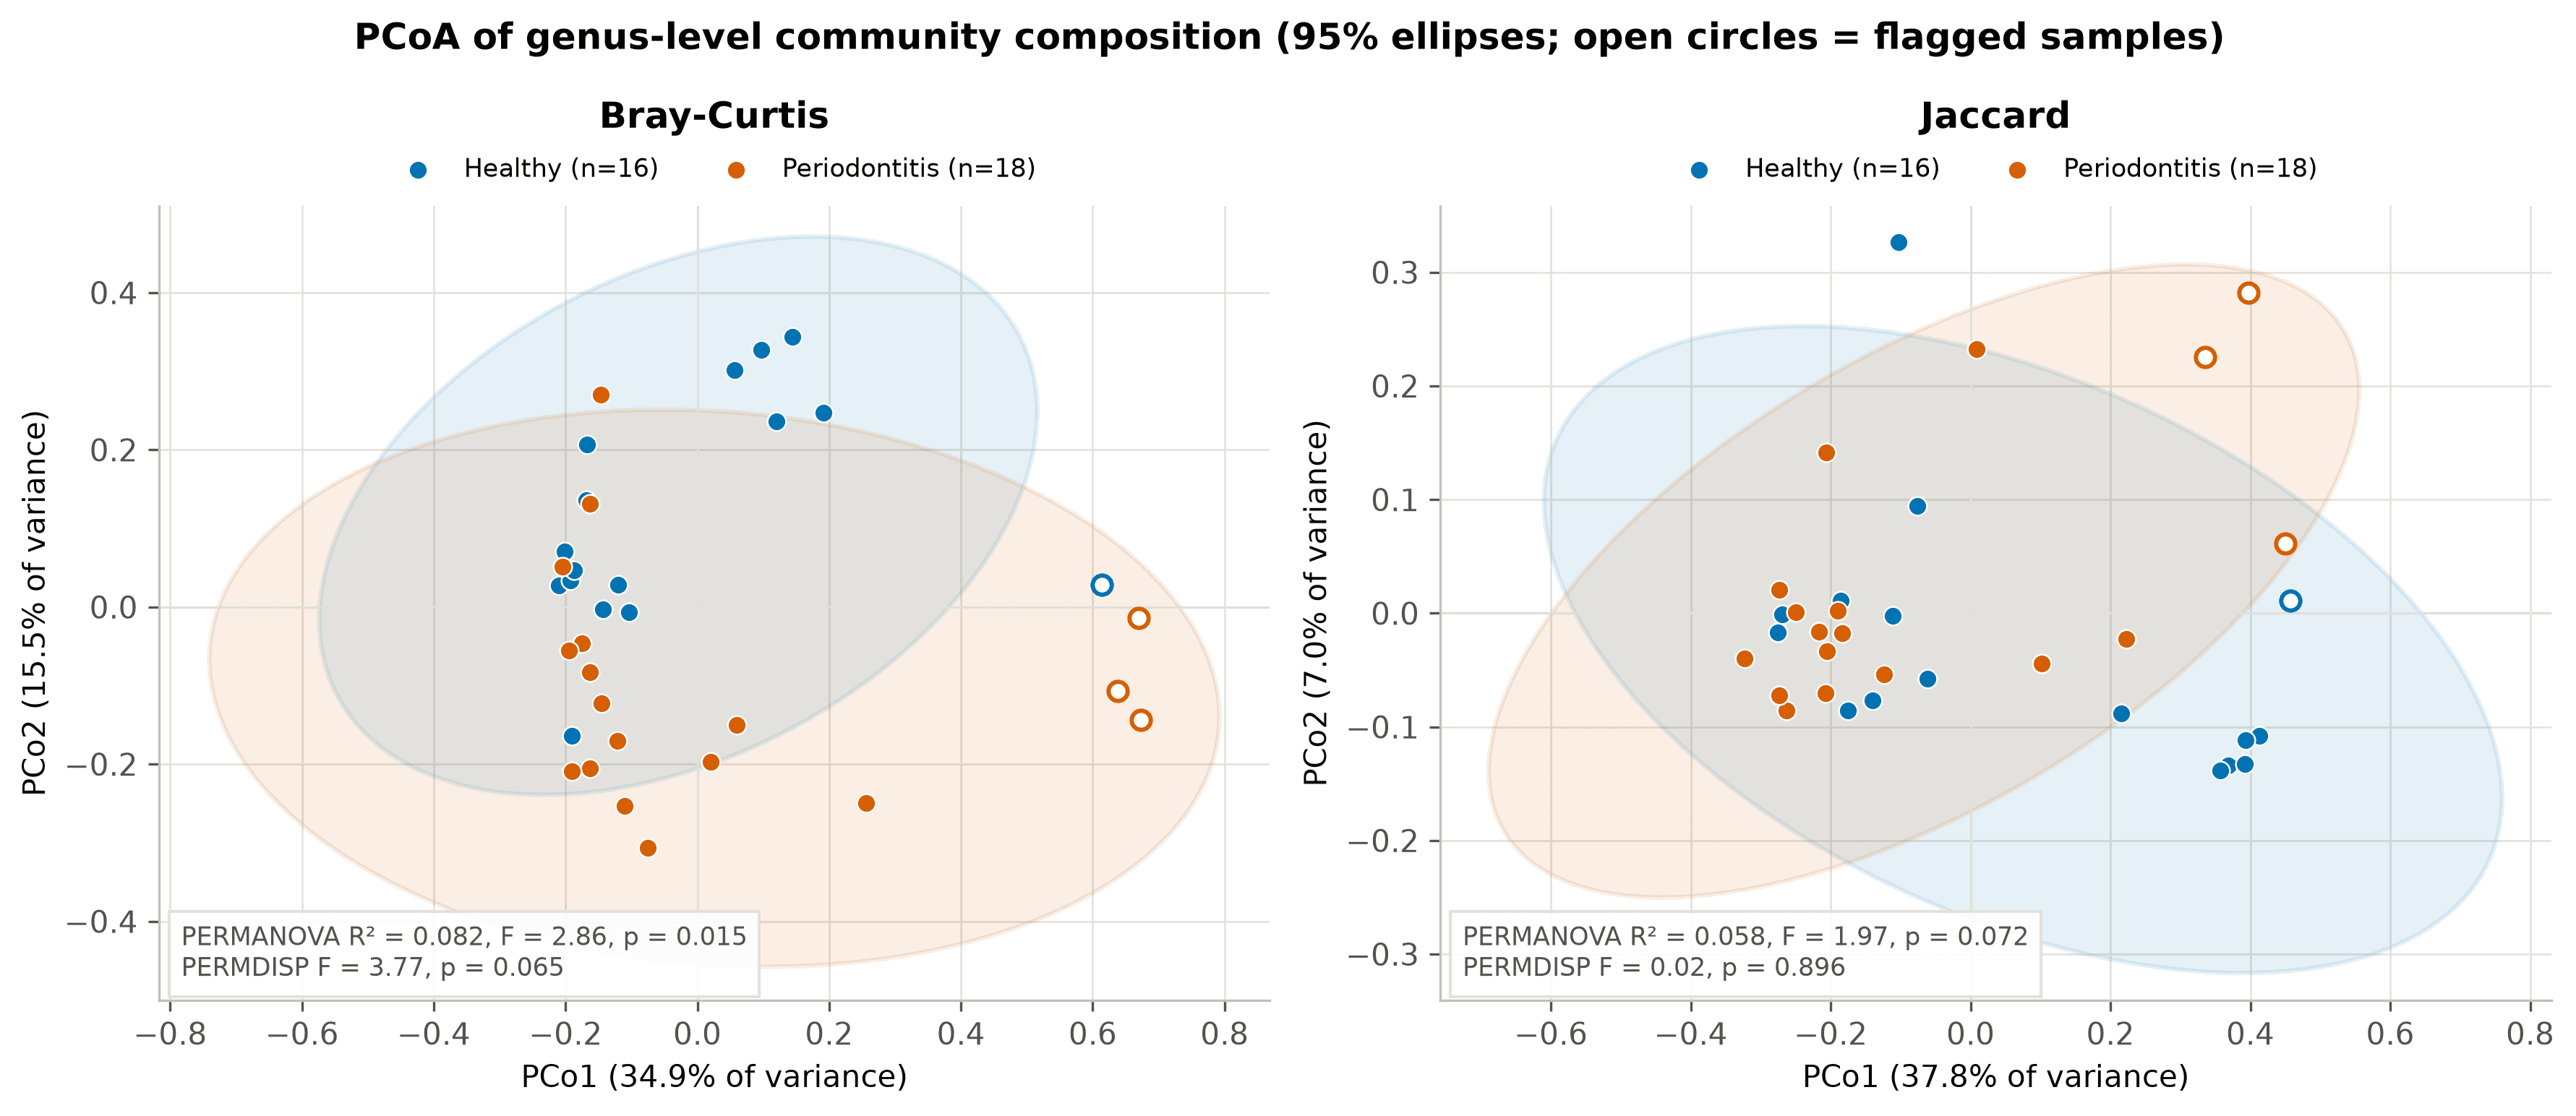
- Beta diversity: Bray-Curtis and Jaccard, PCoA and NMDS with 95% ellipses; PERMANOVA and PERMDISP implemented from scratch with 999 permutations.
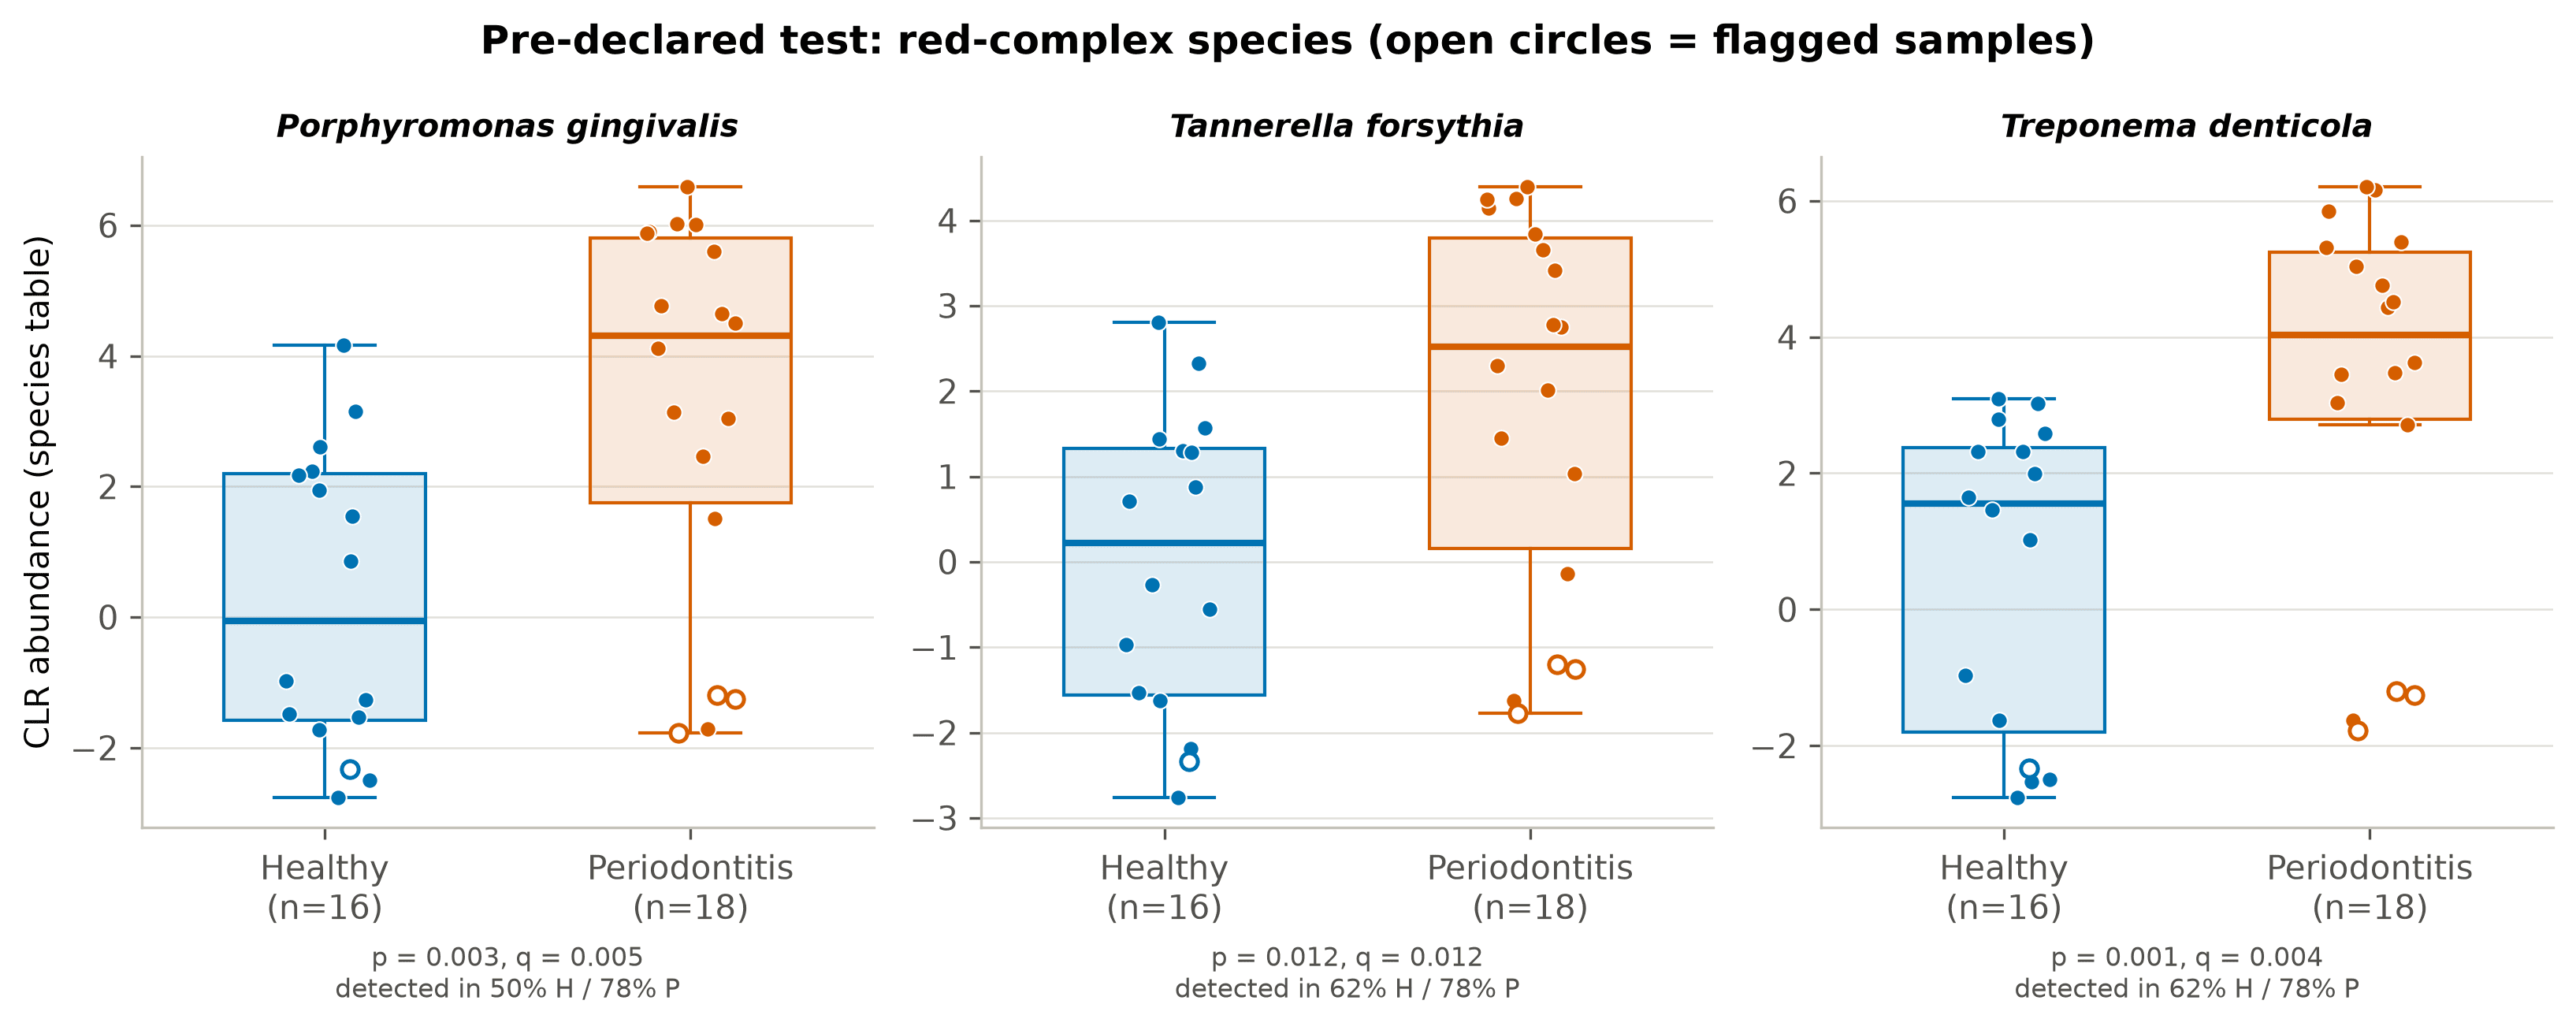
- Differential abundance: per-genus Mann-Whitney U on CLR with BH-FDR and a label-shuffled null, plus a pre-declared species-level red-complex test.
- Co-occurrence network: Spearman correlation on CLR abundances (|rho| ≥ 0.6, q < 0.05), hubs by degree.
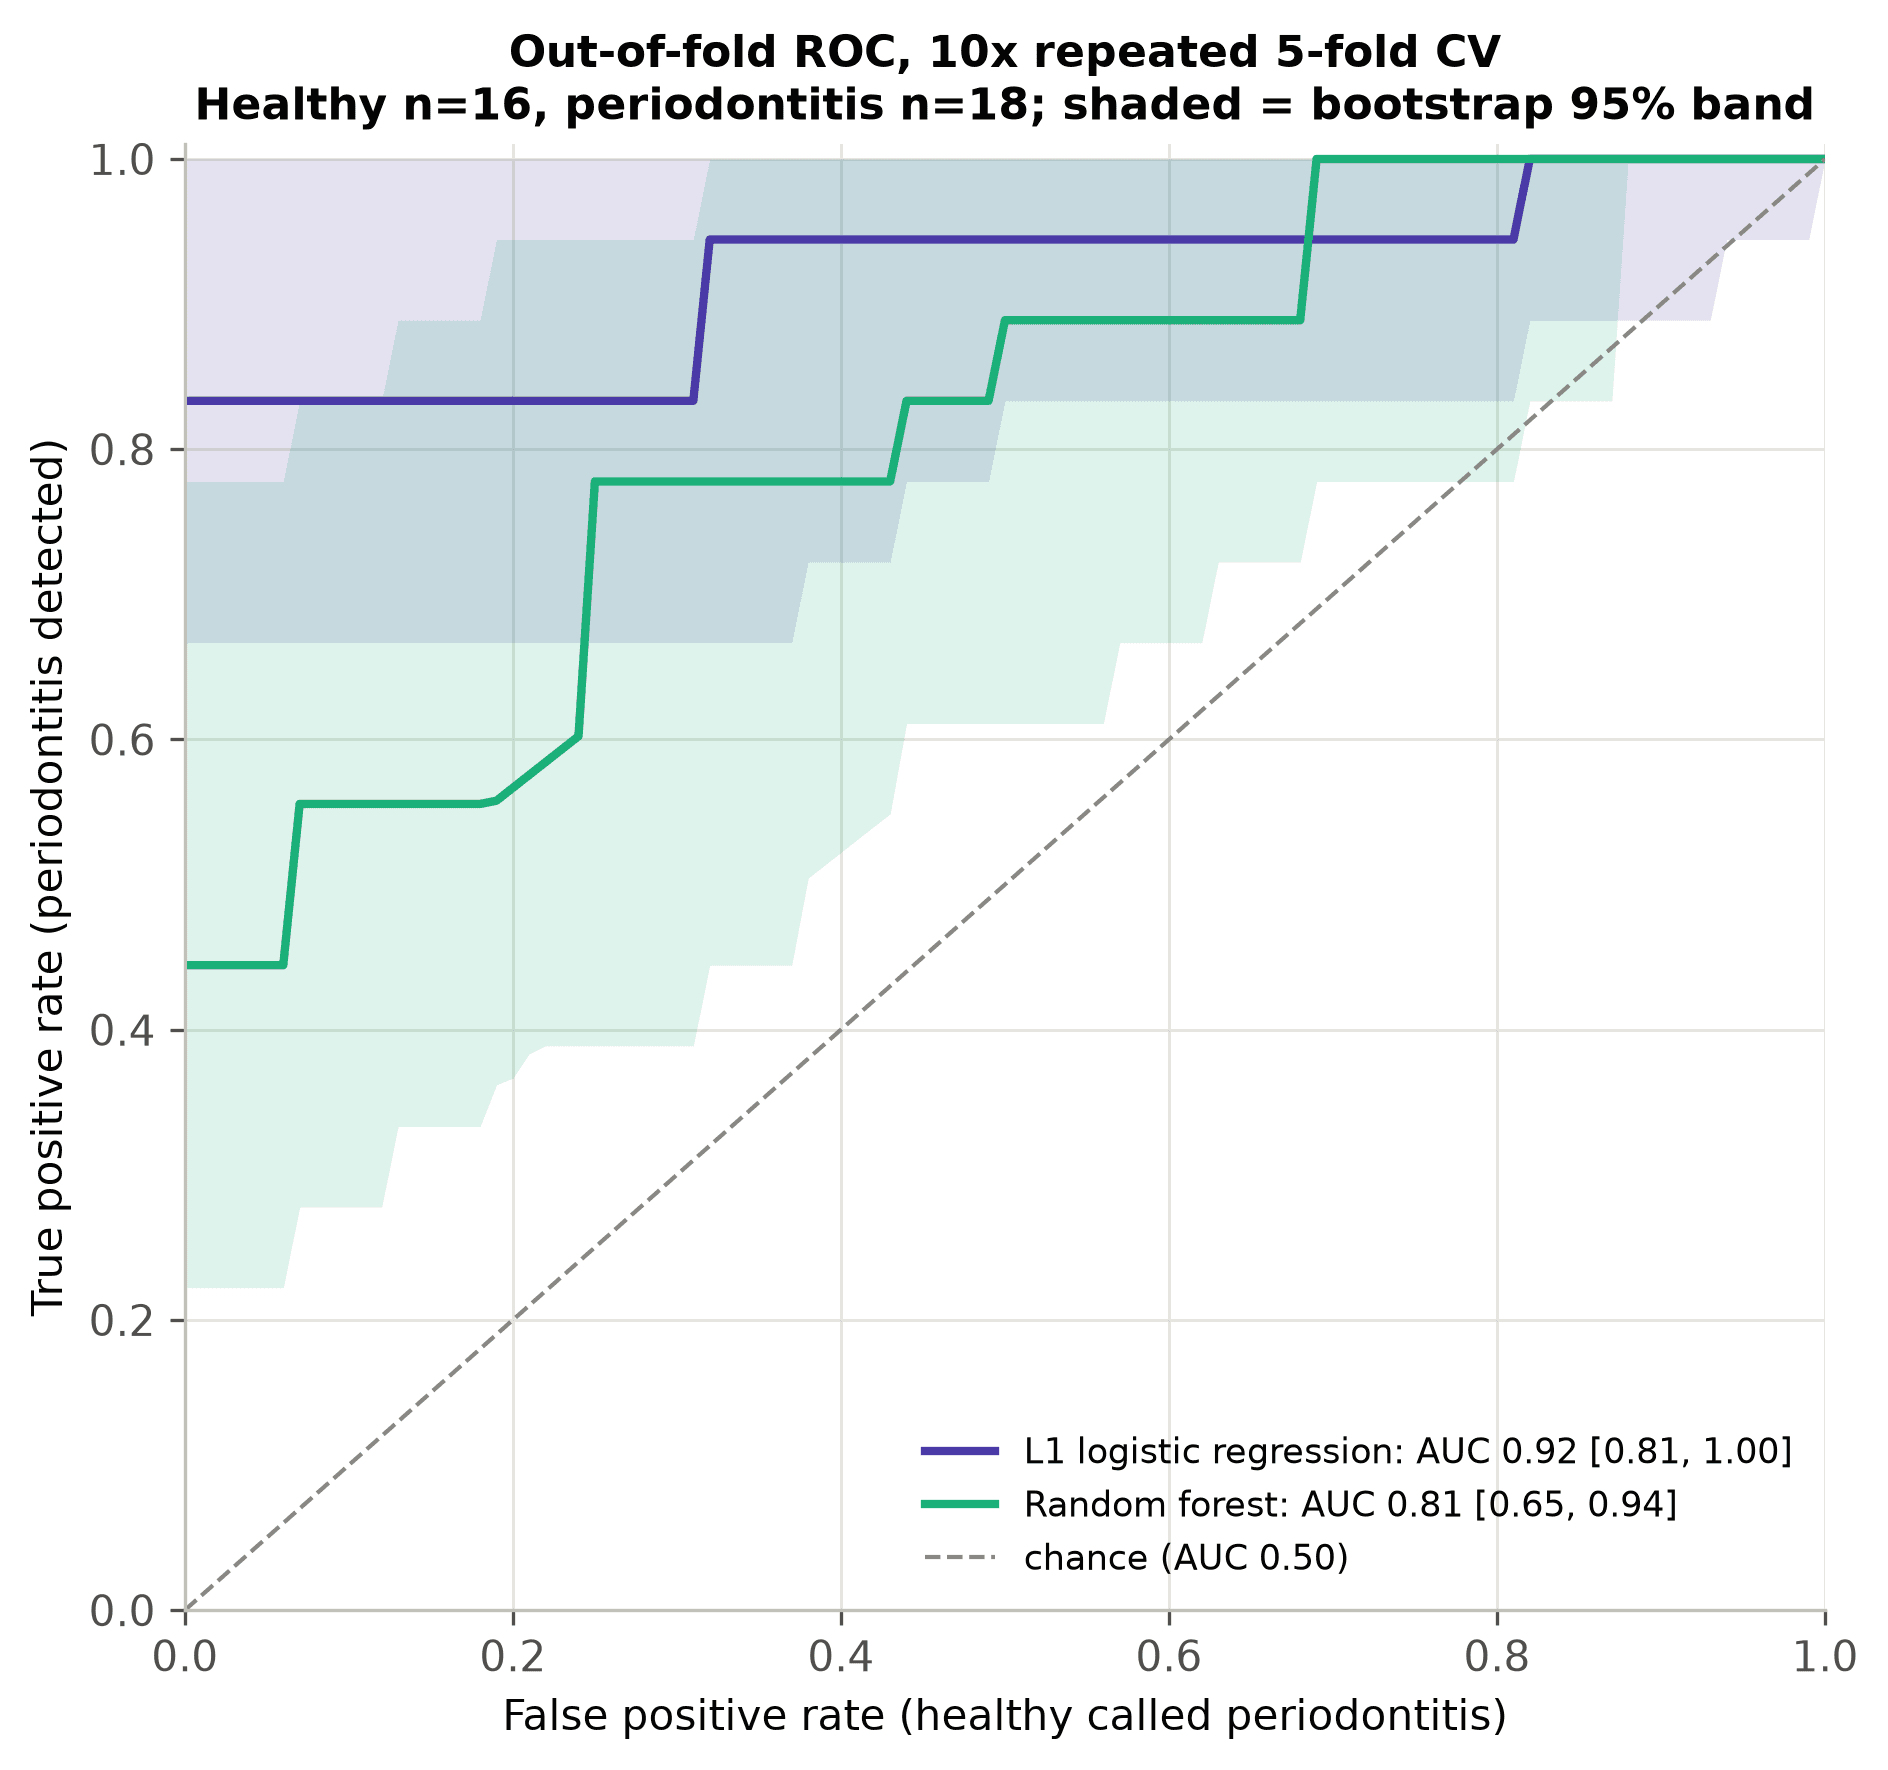
- Classifier: L1 logistic regression (nested CV) and random forest with 10× repeated stratified 5-fold CV, preprocessing inside folds, bootstrap CIs, a 100-shuffle permuted-label null and an ablation.
- Replication: the same pipeline on hypertension vs hypertension + periodontitis; a synthetic Dirichlet-multinomial dataset with planted differences serves as the positive control.
05Tools
- Python
- NumPy
- pandas
- SciPy
- scikit-learn
- matplotlib
- seaborn
- NetworkX
- Streamlit
- Altair
- pytest
06Visualizations
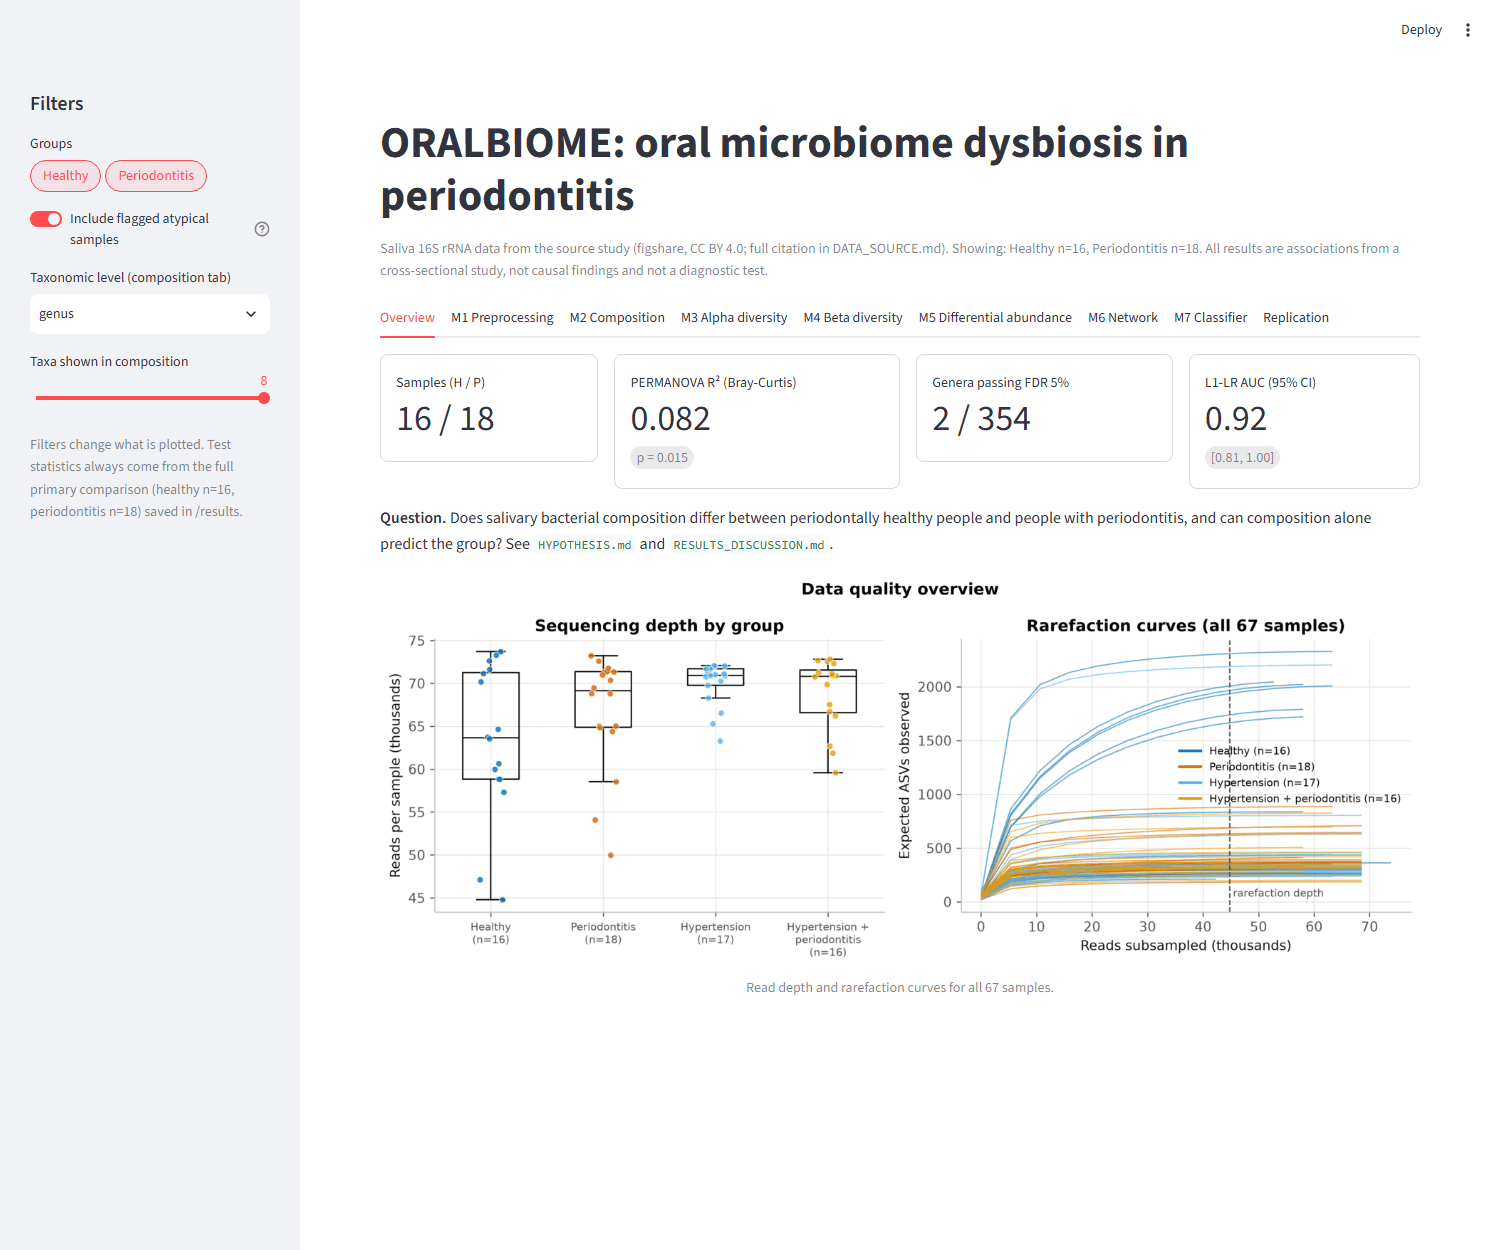
07Findings
- All three pre-declared red-complex species are more abundant in periodontitis saliva: P. gingivalis q = 0.005, T. forsythia q = 0.012, T. denticola q = 0.004.
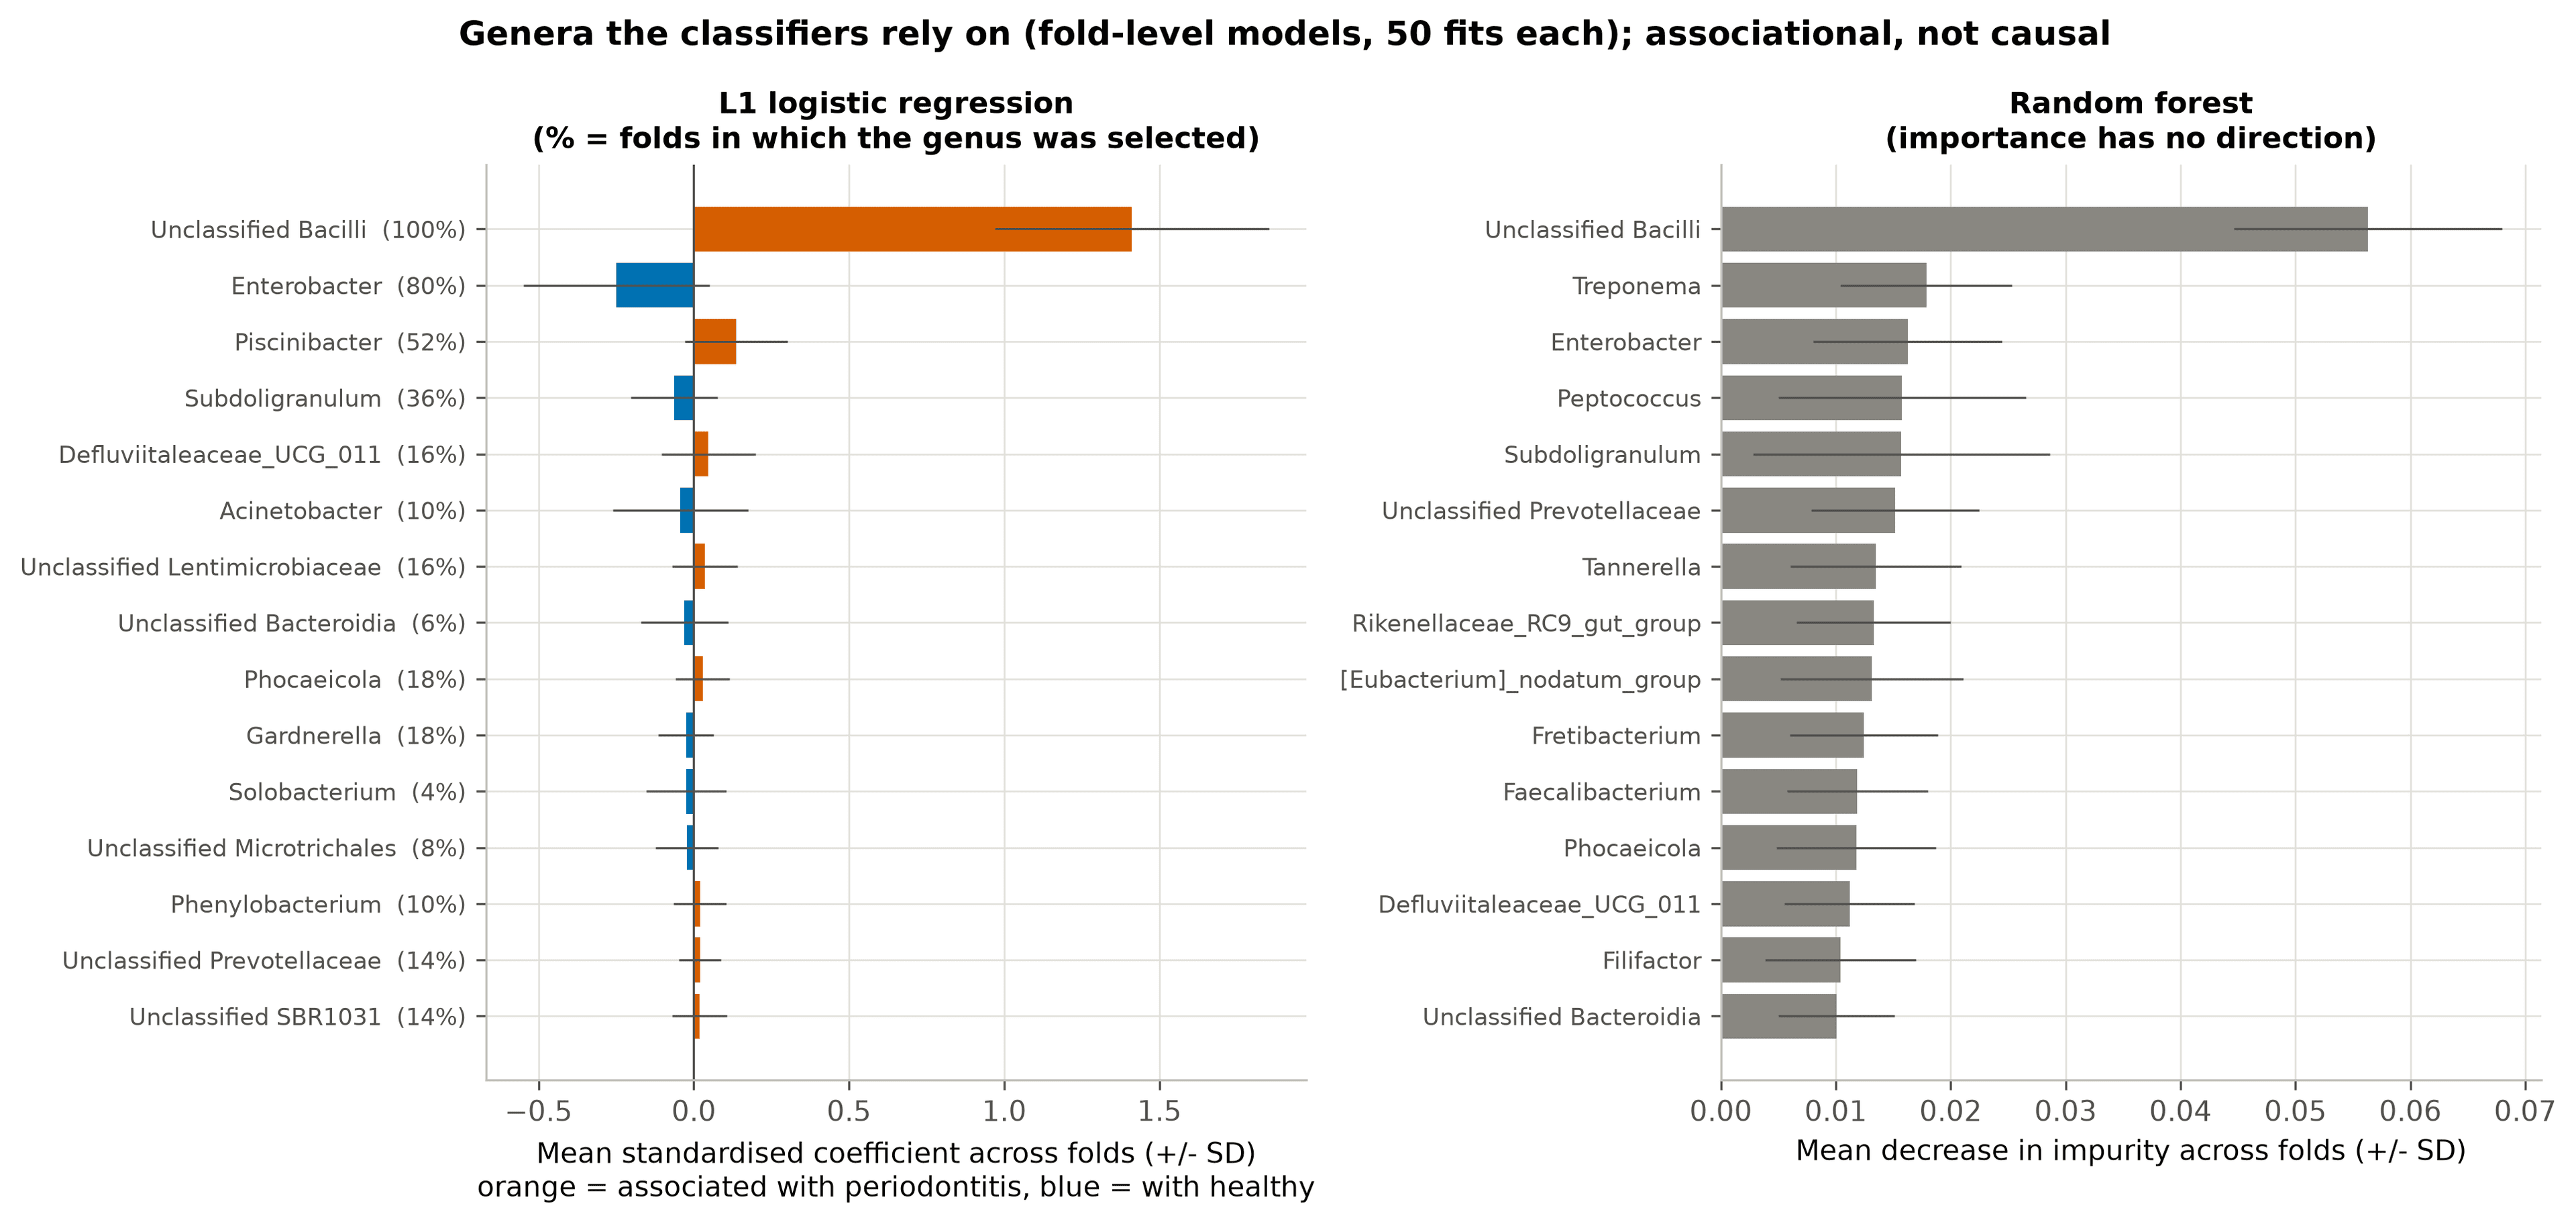
- An L1 logistic regression separates 16 healthy from 18 periodontitis samples above a permuted-label null (AUC 0.92 [0.81, 1.00], permutation p = 0.0099), but it leans heavily on one unidentified taxon, “Unclassified Bacilli”: removing it drops the AUC to 0.64.
- Did not replicate: in the hypertensive participants (17 vs 16), PERMANOVA p = 0.402, the classifier AUC is 0.52 [0.32, 0.72] (permutation p = 0.495) and the red-complex species give q = 0.53–0.76.
- Overall composition differs modestly (Bray-Curtis PERMANOVA R² = 0.082, p = 0.015; PERMDISP p = 0.065), while alpha diversity does not (Shannon p = 0.796; no metric passes BH across six).
- The top healthy-leaning genera (Subdoligranulum, Enterobacter, Nordella, Psychrobacter) are detected in all 6 unusually high-richness healthy samples but rarely elsewhere, so they may reflect contamination or batch rather than biology.
08Limitations
- 16S resolution: a ~470 bp V3–V4 amplicon usually identifies bacteria reliably only to genus, and says nothing about genes, function or live versus dead cells.
- The deposit does not state which reference database assigned the taxonomy; names follow SILVA 138-era conventions, not eHOMD, so species labels carry more uncertainty than genus-level results.
- “Unclassified Bacilli” could not be identified: the deposit contains no representative sequences, so a technical component cannot be excluded.
- Sequencing gives proportions, not absolute amounts; CLR transforms reduce but do not remove this problem.
- Batch effects and contamination cannot be separated from biology: no negative controls or processing-batch information are available.
- Small (16 vs 18), cross-sectional and unadjusted for covariates; saliva from one study and one sequencing run, so the replication is internal only.
- No clinical or diagnostic value: nothing here should be used to diagnose, predict or treat periodontitis.